I live in London. I didn’t really intend to live in London. But I got a job here that seemed to suit me, so I thought maybe it would be OK to live here for a couple of years and then move on.
That was in 1994. Various life events intervened and I sort of got stuck here. But now I’m in the fortunate position where my job is home-based, and my partner also works from home, so we could pretty much live anywhere. So finally, moving out of London is very much on the agenda.
But where should we move to? The main intention is “somewhere more rural than London”, which you will appreciate doesn’t really narrow it down very much. Many people move to a specific location for a convenient commute to work, but we have no such constraints, so we need some other way of deciding.
So I decided to do what all good statisticians do, and use data to come up with the answer.
There is a phenomenal amount of data that can be freely downloaded from the internet these days about various attributes of small geographic areas.
House prices are obviously one of the big considerations. You can download data from the Land Registry on every single residential property transaction going back many years. This needs a bit of work before it becomes usable, but it’s nothing a 3-level mixed effects model with random coefficients at both middle-layer super output area and local authority area can’t sort out (the model actually took about 2 days to run: it’s quite a big dataset).
Although I don’t have to commute to work every day, I’m not completely free of geographic constraints. I travel for work quite a bit, so I don’t want to be too far away from the nearest international airport. My parents, who are not as young as they used to be, live in Sussex, and I don’t want to be too many hours’ drive away from them. My partner also has family in the southeast of England and would like to remain in easy visiting distance. And we both love going on holiday to the Lake District, so somewhere closer to there would be nice (which is of course not all that easy to reconcile with being close to Sussex).
Fortunately, you can download extensive data on journey times from many bits of the country to many other bits, so that can be easily added to the data.
We’d like to live somewhere more rural than London, but don’t want to be absolutely in the middle of nowhere. Somewhere with a few shops and a couple of takeaways and pubs would be good. So I also downloaded data on population density. I figured about 2500 people/square km would be a good compromise between escaping to somewhere more rural and not being in the middle of nowhere, and gave areas more points the closer they came to that ideal.
I’d like to have a big garden, so we also give points to places that have a high ratio of garden space to house space, which can easily be calculated from land use data. Plenty of green space in the area would also be welcome, and we can calculate that from the same dataset.
One of the problems with choosing places with low house prices is that they might turn out to be rather run-down and unpleasant places to live. So I’ve also downloaded data on crime rates and deprivation indices, so that run-down and crime-ridden areas can be penalised.
In addition to all that, I also found data on flood risk, political leanings, education levels, and life satisfaction, which I figured are probably also relevant.
I dare say there are probably other things that could be downloaded and taken into account, though that’s all I can think of for now. Suggestions for other things very welcome via the commenst below.
I then calculate a score for each of those things for each middle-layer super output area (an area of approximately 7000 people), weight each of those things by how important I think it is, and take a weighted average. Anything that scores too badly on an item I figured was important (this was just house prices and distance to my parents) automatically gets a score of zero.
The result is a database of a score for every middle-layer super output area in England and Wales (I figured Scotland was just too far away from Sussex), which I then mapped using the wonderful QGIS mapping software.
The results are actually quite sensitive to the weightings applied to each attribute, so I allowed some of the weightings to vary over reasonable ranges, and then picked the areas that consistently performed well.
The final map looks like this:
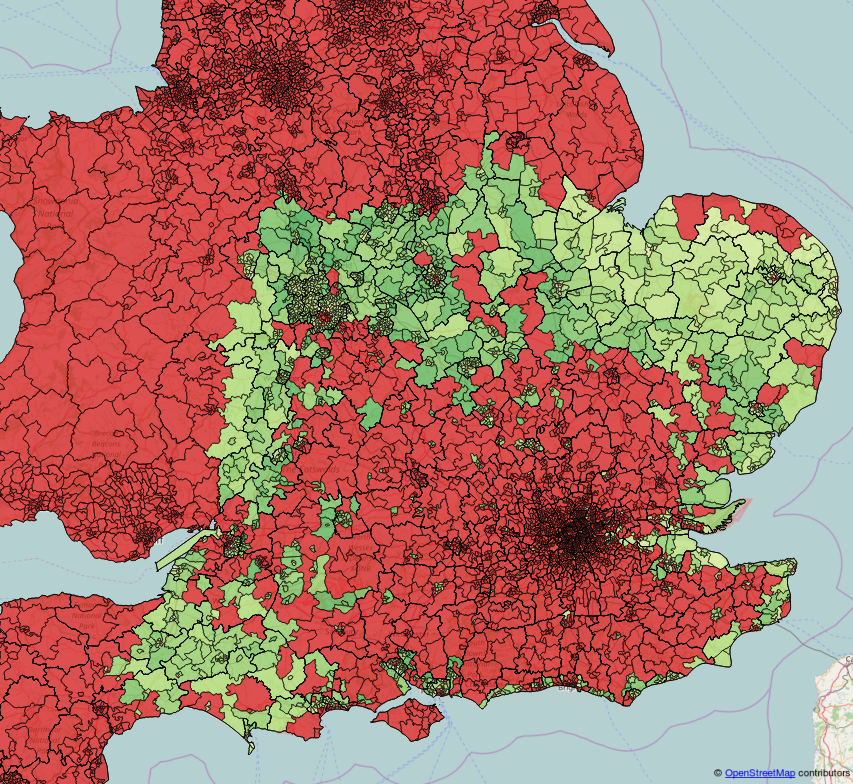
Red areas are those with low scores, green areas are those with high scores.
Not surprisingly, setting a constraint on house prices ruled out almost all of the southeast of England. Setting a constraint on travelling time to visit my parents ruled out most of the north of England. What is left is mainly a little band around the midlands.
And which is the best place to live, taking all that into account? Turns out that it’s Stafford. I’ve actually never been to Stafford. I wonder if it’s a nice place to live? I suppose I should go and visit it sometime and see how well my model did.