I’ve gotta be honest, I hadn’t heard of the concept of a “web bulb temperature” until earlier this year. I’ve heard about them quite a bit in recent months, and I’m sure we’ll all be hearing about them a lot more often from now on.
If the concept is also new to you, let me explain. It’s pretty much what it says. You take a traditional thermometer with a bulb of liquid at the bottom, and you wrap the bulb in a wet cloth. The water in the cloth evaporates, and the evaporative cooling means that the thermometer will read a lower temperature than it would have done if it were dry. The amount of cooling depends on the humidity of the air: in dry conditions, the evaporative cooling is efficient and the wet bulb temperature will be considerably lower than the dry bulb temperature, but in humid conditions, the difference is less marked. At the extreme, in 100% relative humidity, the water cannot evaporate at all and the wet bulb temperature (WBT) will be the same as the dry bulb temperature.
Why does this matter? And why am I writing about physics on a blog that’s mostly about medical statistics? Well, it has important implications for human health. People die in heat waves. And it turns out that WBT is important in understanding just how dangerous a heat wave is.
If you are exposed to 45°C heat for any length of time, that sounds pretty scary, but it need not necessarily be too dangerous as long as the air is not too humid, you are reasonably healthy, and you can stay well hydrated. We have evolved a cunning mechanism to stay cool in hot temperatures, namely sweating. This works in exactly the same way as the evaporative cooling in a wet bulb thermometer, and cools us down. Even if the air temperature is hotter than our body temperature, then in a dry atmosphere we can still cool down by sweating. But if we’re exposed to that kind of heat in humid conditions, then we’re in trouble.
So WBT is a way of measuring the combined effects of temperature and humidity. There is no magic cutoff for WBT below which everyone is fine and above which everyone dies. Moderately high WBTs that are mostly survivable for young healthy people may still kill large numbers of frail elderly people. However, the threshold of a WBT of 35°C is often mentioned as a limit of human survivability, and some research suggests that lower WBTs may be dangerous even to young healthy people. Certainly for people who aren’t young and healthy, high-ish WBTs below 35°C are likely to cause considerable excess mortality. The duration of high temperatures is also important. An extreme WBT may be survivable for 30 min, but not if you’re exposed to it for several hours.
The idea for writing this blogpost came from a conversation on social media. Fellow Mastodon user Kenneth Freeman asked the question of whether there is any way to know when WBTs hit 35°C somewhere on the planet. After a little bit of thought, I realised that this was a really important question to answer, so I thought I’d have a go.
If you are impatient to know what the answer is, feel free to skip to the results below. But if you are interested in all the geeky stuff about how I found out, then read on.
There are many weather-related websites that will let you search for the weather conditions at a given location at a given time. However, although they are presumably linked up to giant datasets of weather conditions at different locations and times, and so could in theory be easily queried to find the locations and times for specific weather conditions, I couldn’t find any website that would let you search that way round. But Kenneth tooted a link to an relevant scientific paper which had also examined the question of how often WBTs of 35°C are observed. They had used data from the HadISD dataset: a large dataset of observations from weather stations around the world, going back in some cases to the 1930s and updated monthly with the latest data, which is freely available online thanks to the UK Met Office. This seemed to be a good way to find out the answer to Kenneth’s question.
A good way, though not a trivially easy way. There are about 23GB of data in the dataset, which all needs to be sifted through. The dataset is stored in netCDF files, which apparently is a format used widely in climate science, but was new to me. However, there is of course a Python package to read netCDF files, so after a brief learning curve I was able to read the data and look for high values of WBT using Python code.
As an aside, this project turned out to be a brilliant example of the power of open data. One of the things that 20+ years’ professional experience as a statistician has taught me is that you should always make sure you understand exactly what you are looking at in your dataset before you try to do anything with the data. So as part of that process, I re-calculated the WBTs using the temperature and humidity data in the dataset to make sure I’d understood what the WBT variable in the dataset was and that it was what I was expecting it to be.
The WBTs that I calculated were not the same as the WBTs provided in the dataset.
I assumed at this stage that I must have got something wrong. I’m a medical statistician, not a climate scientist, and I figured that the climate scientists at the Met Office would know how to calculate WBT better than I do. So I emailed the Met Office to ask them what I was doing wrong, and it turned out that in fact my calculations were correct and they had an error in their code that they’d used to calculate WBT. I have to say that I am very impressed with the speed with which they corrected their data. The day after I emailed them, an updated version of the dataset appeared on their website, along with an explanation that they’d had to correct it.
It’s ever so easy to make mistakes when analysing data. We all do it. By making their data freely available online, the Met Office had vastly increased the chances that someone might come along and spot the mistake so it could be corrected. How long would that error have remained in the dataset if the data had not been freely available, one wonders? Top marks to the Met Office for making the data available and for promptly and transparently correcting the error once I’d alerted them to it.
Although the dataset goes back to the 1930s in some cases, most of the weather stations included in the dataset don’t go back that far. Many of the stations came on stream in the 1970s and 1980s. By 1990, 90% of the current number of weather stations were already contributing data. So I am starting my analysis at 1990, to avoid the problem of trying to make comparisons across time periods with vastly different amounts of data collection.
In addition to that, the data quality before 1990 looks like it may not always be that great. I did have a look back at earlier data to see what was there, and I found one weather station in the US with some very prolonged spells of WBT > 35°C around 1980. This seemed like such an outlier I contacted the Met Office about it (it has to be said that the team behind the HadISD dataset at the Met Office are wonderfully helpful people), and after taking a look at it they thought that the data really didn’t seem reliable, and that the most likely explanation was that the temperature data had been recorded in Fahrenheit and whoever originally uploaded the data had forgotten to convert it to Celsius.
Data quality is something that needs a lot of careful work, and the Met Office do have some extensive quality control procedures, which are described in a published paper. Of course the occasional spurious value can slip through even the most rigorous quality control, but having excluded the pre-1990 data, I am assuming that the Met Office’s quality control procedures are good enough and that the data are reliable. Certainly nothing else I’ve seen later than those values from the US station around 1980 leapt out at me as being obviously weird.
This analysis is somewhat quick and dirty at this stage. You will note that I’ve called this post “Wet Bulb Temperatures, Part 1”, as I plan to come back another day and tell you about some more sophisticated analyses. I don’t have any maps to show you today, and I’d love to do that in the reasonably near future. I have also used a very rough and ready method of calculating the duration of spells of high WBT: I have assumed that the spell lasted from the first time a weather station recorded a WBT above the threshold and ended at the last time the WBT was above the threshold at the same station, having been consistently above the threshold since. For long spells and stations that record data every hour, that’s probably not a bad approximation. However, consider a hypothetical example of a station reporting data only every 3 hours, with the WBT at 34.9 at 1200, 36 at 1500, and 34.9 at 1800. I would have counted this as a zero duration above 35, as there was only a single observation above 35. However, in practice, the WBT was probably above 35 for most of the time between 1200 and 1800. So my analysis here is rather conservative: the actual number of spells of long duration is probably higher than I’m reporting here. It wouldn’t be that hard to come up with more accurate estimates by interpolation between the observations, but I haven’t done that yet. I’ll do that another time and let you know what that looks like.
I have also not taken account of where stations are. If 2 stations that are close to each other both report episodes of high WBT at the same time, I have counted that as 2 separate episodes, although it might be more accurate to count it as 1 big episode. However, I guess it’s still a measure of how serious the extreme temperatures are. Also, what I’m focusing mostly on here is episodes where the WBT was at least 35°C for 6 h, as those as the episodes which are most likely to pose a serious threat to human survivability, and I have checked and none of those episodes were recorded at more than one station on a single day. I can’t promise that’s true of some of the less extreme episode durations. I hope to do some kind of analysis of the geographical extent of extreme WBT episodes some other time.
And my final caveat is that I am a medical statistician, not a climate scientist. I am aware that I’m going rather outside my field of expertise by analysing climate data, and I can’t exclude the possibility that I have overlooked something really important that would be obvious to any climate scientist. If you think I have erred in that way, do let me know via the comments below.
Anyway, with those caveats in mind, let’s look at the results.
Results
I’ll start with a list of extreme WBT episodes. These were any time the WBT was at least 35°C for 6 h or more (there were in fact no episodes longer than 6 h), or was at least 32°C for more than 12 h.
| Weather station | Date of observation | Hours WBT ≥ 35 | Hours WBT ≥ 32 | Max WBT |
| 944490-99999, LAVERTON AERO, Shire Of Laverton, Western Australia, 6440, Australia (-28.617, 122.417) | 22 Jan 1995 | 6 | 6 | 36.2 |
| 412460-99999, SOHAR MAJIS, Al Batinah North Governorate, Oman (24.467, 56.65) | 5 Jul 1998 | 15 | 32.9 | |
| 412460-99999, SOHAR MAJIS, Al Batinah North Governorate, Oman (24.467, 56.65) | 12 Jul 1998 | 18 | 34.2 | |
| 412420-99999, DIBA, Musandam Governorate, Oman (25.617, 56.25) | 8 Jul 2001 | 15 | 33.4 | |
| 412420-99999, DIBA, Musandam Governorate, Oman (25.617, 56.25) | 4 Jul 2002 | 18 | 33.2 | |
| 412580-99999, MINA SULTAN QABOOS, Muscat, Muscat Governorate, Oman (23.633, 58.567) | 28 Jun 2004 | 15 | 32.7 | |
| 412420-99999, DIBA, Musandam Governorate, Oman (25.617, 56.25) | 12 Jul 2004 | 15 | 33.5 | |
| 417150-99999, SHAHBAZ AB, Shikārpur District, Sindh, Pakistan (28.284, 68.45) | 6 Jun 2005 | 6 | 12 | 37.4 |
| 942170-99999, ARGYLE AERODROME, Shire Of Wyndham-East Kimberley, Western Australia, Australia (-16.633, 128.45) | 13 Jan 2013 | 6 | 12 | 36.9 |
| 946590-99999, WOOMERA, Pastoral Unincorporated Area, South Australia, Australia (-31.144, 136.817) | 11 Mar 2013 | 6 | 9 | 36.6 |
| 760400-99999, EJIDO NUEVO LEON BC., Municipio de Mexicali, Baja California, Mexico (32.4, -115.183) | 23 Jul 2018 | 6 | 12 | 38.4 |
| 412170-99999, ABU DHABI INTL, Abu Dhabi, Abu Dhabi Emirate, United Arab Emirates (24.433, 54.651) | 19 Aug 2020 | 15 | 33.1 | |
| 760400-99999, EJIDO NUEVO LEON BC., Municipio de Mexicali, Baja California, Mexico (32.4, -115.183) | 21 Jul 2021 | 6 | 6 | 37.5 |
| 760400-99999, EJIDO NUEVO LEON BC., Municipio de Mexicali, Baja California, Mexico (32.4, -115.183) | 16 Aug 2021 | 6 | 6 | 37.2 |
| 412670-99999, QALHAT, Ash Sharqiyah South Governorate, Oman (22.667, 59.4) | 9 Jul 2022 | 3 | 33 | 36.2 |
| 412400-99999, KHASAB PORT, Musandam Governorate, Oman (26.217, 56.25) | 24 Aug 2023 | 30 | 33.1 |
(The “Weather station” details are the ID number of the weather station and its name as recorded in the HadISD dataset, followed by the address of its region, and finally the latitude and longitude coordinates.)
What we can see is that there have been only a handful of episodes of a WBT of ≥ 35°C that lasted for 6h, and they are skewed towards the more recent years of the dataset. What is particularly striking is that the paper by Raymond et al I linked to previously, published in 2020 and using data up to 2017, which looked at the emergence of high WBTs, is already badly out of date. Of the 7 episodes of WBT ≥ 35°C that I have found, 3 of them have occurred after 2017. There are also 2 episodes of WBT ≥ 32°C that lasted for over 24 hours, which must be very hard to deal with, which have both occurred in the last couple of years.
Although I haven’t done any statistical analysis to see how likely it is that the clustering of extreme heat episodes in the later period could be due to chance, it certainly looks at first glance that the frequency of such events is increasing.
Let’s look at some graphs as well. Here are the number of episodes of WBTs above thresholds from 32 to 35°C of varying durations over time.
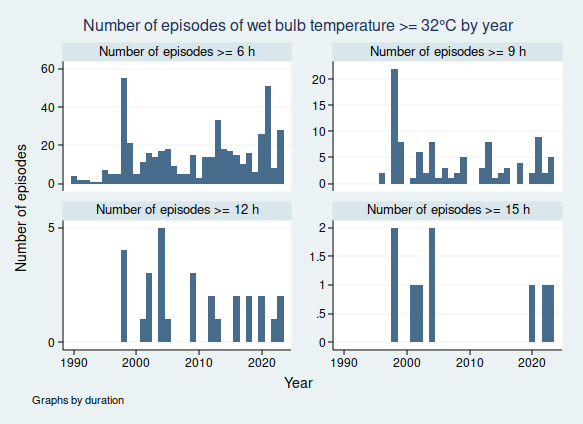
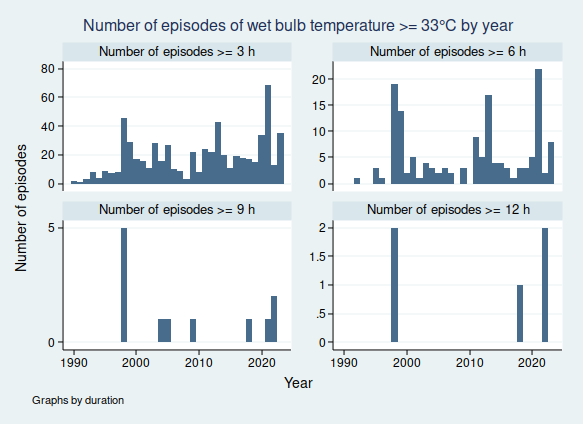
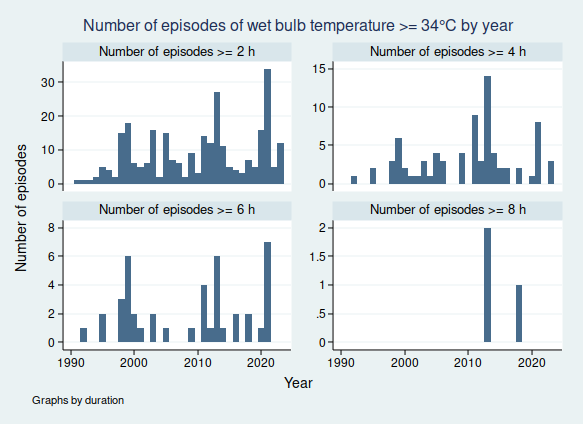
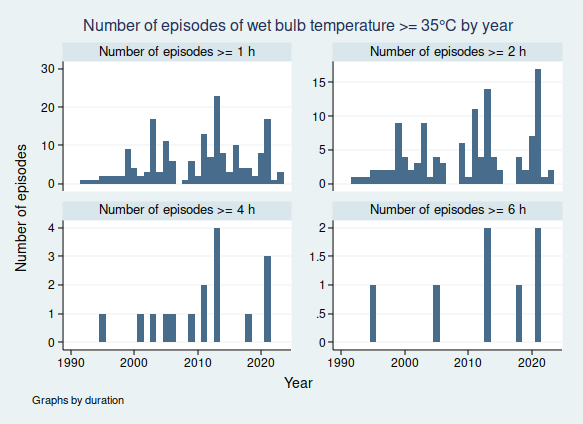
Again, I have not done any statistical analysis of this, but it does seem that there is an upward trend in many of those graphs with the frequency of high WBT events increasing over time.
If this trend of increasingly extreme WBT events continues, this could have serious implications for human health in the affected areas. It is no exaggeration to say that thousands, maybe millions, could die in such extreme weather events.
So this would be a really bad time to relax our efforts to reduce greenhouse gas emissions. But surely no-one would be stupid enough to do that, would they?
Update 29 December 2023: please see the next post, Wet Bulb Temperatures, Part 2, which explains why much of the data above may not be all it seems.