One thing about the Covid-19 outbreak that has been particularly noticeable to me as a medical statistician is that the number of confirmed cases reported in the UK has been following a classic exponential growth pattern. For those who are not familiar with what exponential growth is, I’ll start with a short explanation before I move on to what this means for how the epidemic is likely to develop in the UK. If you already understand what exponential growth is, then feel free to skip to the section “Implications for the UK Covid-19 epidemic”.
A quick introduction to exponential growth
If we think of something, such as the number of cases of Covid-19 infection, as growing at a constant rate, then we might think that we would have a similar number of new cases each day. That would be a linear growth pattern. Let’s assume that we have 50 new cases each day, then after 60 days we’ll have 3000 cases. A graph of that would look like this:
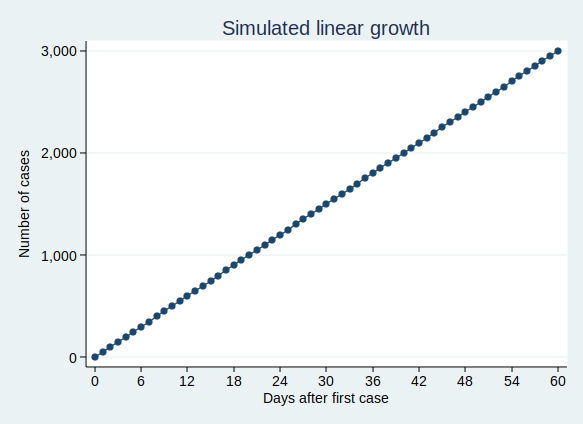
That’s not what we’re seeing with Covid-19 cases. Rather than following a linear growth pattern, we’re seeing an exponential growth pattern. With exponential growth, rather than adding a constant number of new cases each day, the number of cases increases by a constant percentage amount each day. Equivalently, the number of cases multiplies by a constant factor in a constant time interval.
Let’s say that the number of cases doubles every 3 days. On day zero we have just one case, on day 3 we have 2 cases, and day 6 we have 4 cases, on day 9 we have 8 cases, and so on. This makes sense for an infectious disease epidemic. If you imagine that each person who is infected can infect (for example) 2 new people, then you would get a pattern very similar to this. When only one person is infected, that’s just 2 new people who get infected, but if 100 people have the disease, then 200 people will get infected in the same time.
On the face of it, the example above sounds like it’s growing much less quickly than my first example where we have 50 new cases each day. But if you are doubling the number of cases each time, then you start to get to scarily large numbers quite quickly. If we carry on for 60 days, then although the number of cases isn’t increasing much at first, it eventually starts to increase at an alarming rate, and by the end of 60 days we have over a million cases. This is what it looks like if you plot the graph:
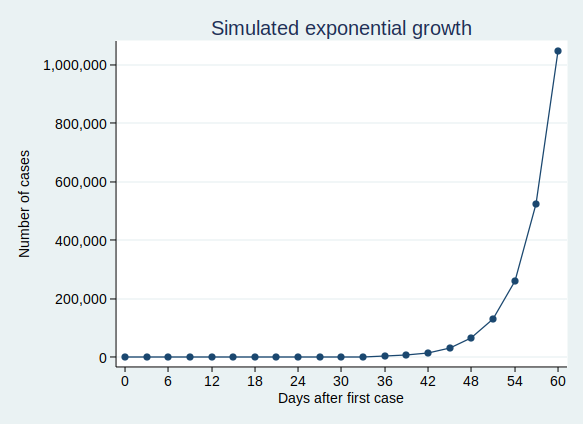
It’s actually quite hard to see what’s happening at the beginning of that curve, so to make it easier to see, let’s use the trick of plotting the number of cases on a logarithmic scale. What that means is that a constant interval on the vertical axis (generally known as the y axis) represents not a constant difference, but a constant ratio. Here, the ticks on the y axis represent an increase in cases by a factor of 10.
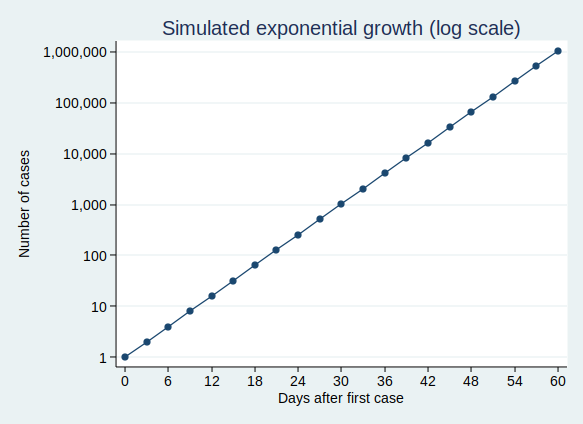
Note that when you plot exponential growth on a logarithmic scale, you get a straight line. That’s because we’re increasing the number of cases by a constant ratio in each unit time, and a constant ratio corresponds to a constant distance on the y axis.
Implications for the UK Covid-19 epidemic
OK, so that’s what exponential growth looks like. What can we see about the number of confirmed Covid-19 cases in the UK? Public Health England makes the data available for download here. The data have not yet been updated with today’s count of cases as I write this, so I added in today’s number (1372) based on a tweet by the Department of Health and Social Care.
If you plot the number of cases by date, it looks like this:
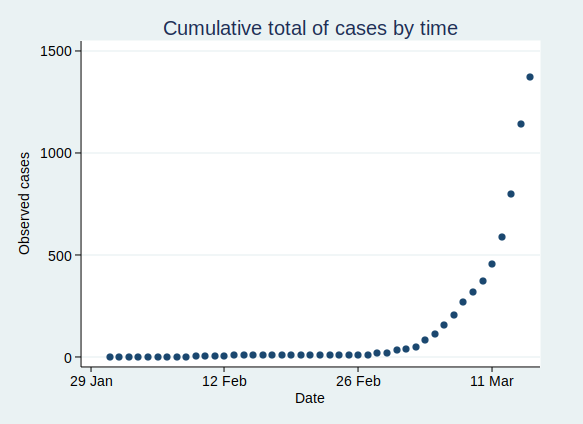
That’s pretty reminiscent of our exponential growth curve above, isn’t it?
It’s worth noting that the numbers I’ve shown are almost certainly an underestimate of the true number of cases. First, it seems likely that some people who are infected will have only very mild (or even no) symptoms, and will not bother to contact the health services to get tested. You might say that it doesn’t matter if the numbers don’t include people who aren’t actually ill, and to some extent it doesn’t, but remember that they may still be able to infect others. Also, there is a delay from infection to appearing in the statistics. So the official number of confirmed cases includes people only after they have caught the disease, gone through the incubation period, developed symptoms that were bothersome enough to seek medical help, got tested, and have the test results come back. This represents people who were infected probably at least a week ago. Given that the number of cases are growing so rapidly, the number of people actually infected today will be considerably higher than today’s statistics for confirmed cases.
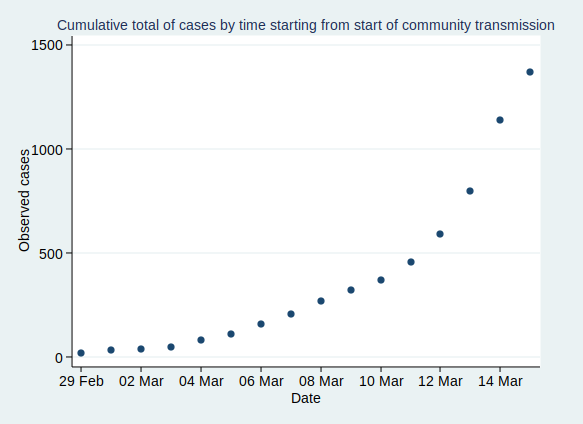
Now, before I get into analysis, I need to decide where to start the analysis. I’m going to start from 29 February, as that was when the first case of community transmission was reported, so by then the disease was circulating within the UK community. Before then it had mainly been driven by people arriving in the UK from places abroad where they caught the disease, so the pattern was probably a bit different then.
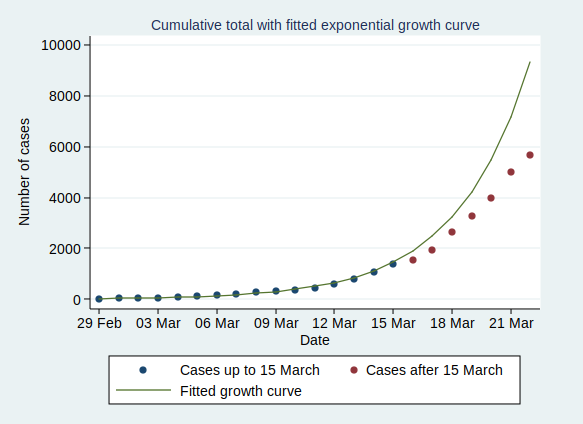
If we start the graph at 29 February, it looks like this:
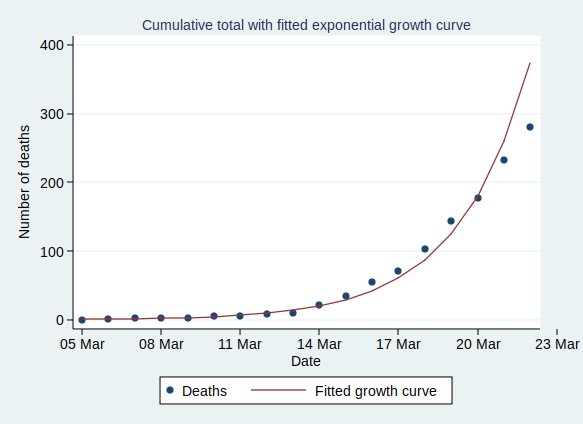
Now, what happens if we fit an exponential growth curve to it? It looks like this:
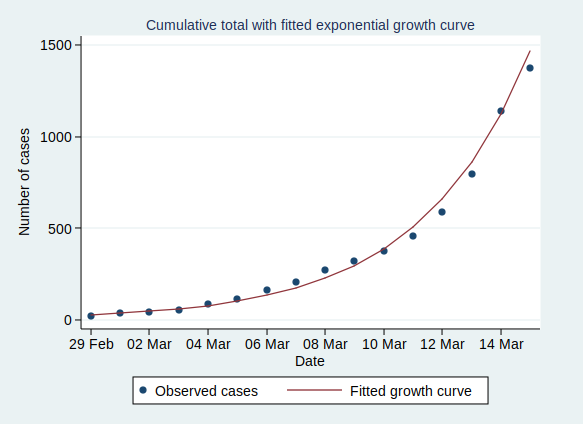
(Technical note for stats geeks: the way we actually do that is with a linear regression analysis of the logarithm of the number of cases on time, calculate the predicted values of the logarithm from that regression analysis, and then back-transform to get the number of cases.)
As you can see, it’s a pretty good fit to an exponential curve. In fact it’s really very good indeed. The R-squared value from the regression analysis is 0.99. R-squared is a measure of how well the data fit the modelled relationship on a scale of 0 to 1, so 0.99 is a damn near perfect fit.
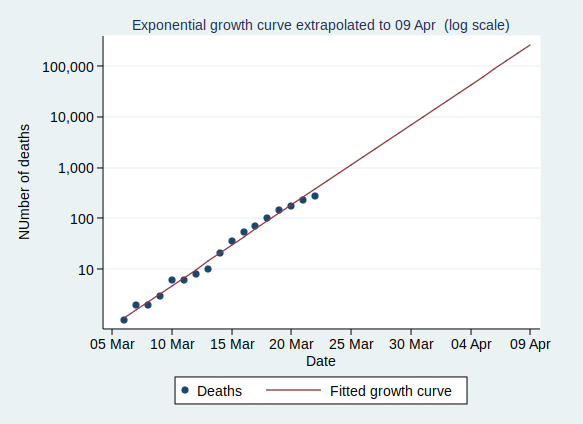
We can also plot it on a logarithmic scale, when it should look like a straight line:
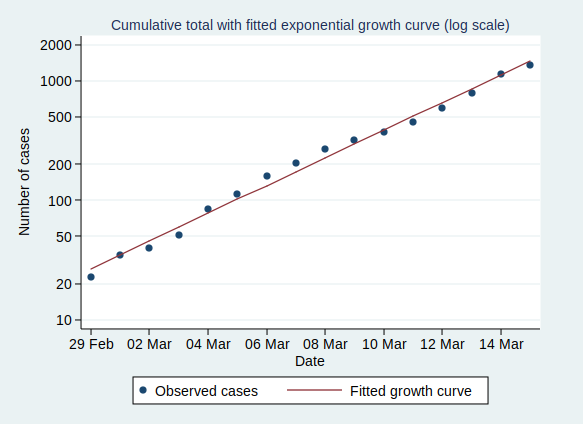
And indeed it does.
There are some interesting statistics we can calculate from the above analysis. The average rate of growth is about a 30% increase in the number of cases each day. That means that the number of cases doubles about every 2.6 days, and increases tenfold in about 8.6 days.
So what happens if the number of cases keeps growing at the same rate? Let’s extrapolate that line for another 6 weeks:
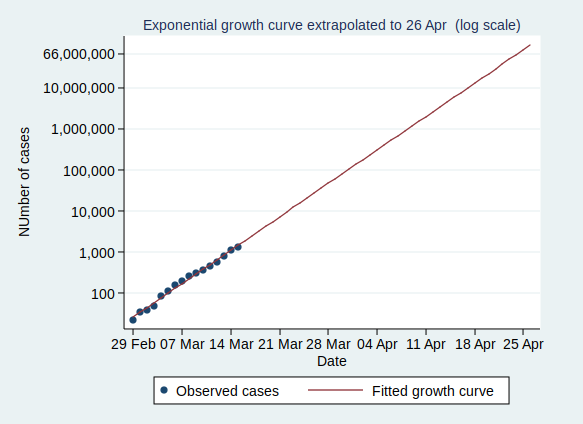
This looks pretty scary. If it continues at the same rate of exponential growth, we’ll get to 10,000 cases by 23 March (which is only just over a week away), to 100,000 cases by the end of March, to a million cases by 9 April, and to 10 million cases by 18 April. By 24 April the entire population of the UK (about 66 million) will be infected.
Now, obviously it’s not going to continue growing at the same rate for all that time. If nothing else, it will stop growing when it runs out of people to infect. And even if the entire population have not been infected, the rate of new infections will surely slow down once enough people have been infected, as it becomes increasingly unlikely that anyone with the disease who might be able to pass it on will encounter someone who hasn’t yet had it (I’m assuming here that people who have already had the disease will be immune to further infections, which seems likely, although we don’t yet know that for sure).
However, that effect won’t kick in until at least several million people have been infected, a situation which we will reach by the middle of April if other factors don’t cause the rate to slow down first.
Several million people being infected is a pretty scary prospect. Even if the fatality rate is “only” about 1%, then 1% of several million is several tens of thousands of deaths.
So will the rate slow down before we get to that stage?
I genuinely don’t know. I’m not an expert in infectious disease epidemiology. I can see that the data are following a textbook exponential growth pattern so far, but I don’t know how long it will continue.
Governments in many countries are introducing drastic measures to attempt to reduce the spread of the disease.
The UK government is not.
It is not clear to me why the UK government is taking a more relaxed approach. They say that they are being guided by the science, but since they have not published the details of their scientific modelling and reasoning, it is not possible for the rest of us to judge whether their interpretation of the science is more reasonable than that of many other European countries.
Maybe the rate of infection will start to slow down now that there is so much awareness of the disease and of precautions such as hand-washing, and that even in the absence of government advice, many large gatherings are being cancelled.
Or maybe it won’t. We will know more over the coming weeks.
One final thought. The government’s latest advice is for people with mild forms of the disease not to seek medical help. This means that the rate of increase of the disease may well appear to slow down as measured by the official statistics, as many people with mild disease will no longer be tested and so not be counted. It will be hard to know whether the rate of infection is really slowing down.