This post was inspired by an article on the BBC website by Martin Rosenbaum, which presented data on a localised breakdown of EU referendum voting figures, and a subsequent discussion of those results in a Facebook group. In that discussion, I observed that the negative correlation between the percentage of graduates in an electoral ward and the leave vote in that ward was remarkable, and much higher than any correlation you normally see in the social sciences. My friend Barry observed that age was also correlated with voting leave, and that it was likely that age would be correlated with the percentage of graduates, and questioned whether the percentage of graduates was really an independent predictor, or whether a high percentage of graduates was more a marker for a young population.
The BBC article, fascinating though it is, didn’t really present its findings in enough detail to be able to answer that question. Happily, Rosenbaum made his raw data on voting results available, and data on age and education are readily downloadable from the Nomis website, so I was able to run the analysis myself to investigate.
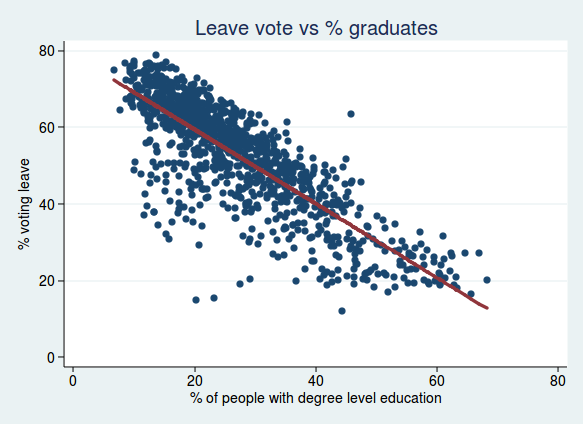
To start with, I ran the same analyses as described in Rosenbaum’s article, and I’m happy to say I got the same results. Here is the correlation between voting leave and the percentage of graduates, together with a best-fit regression line:
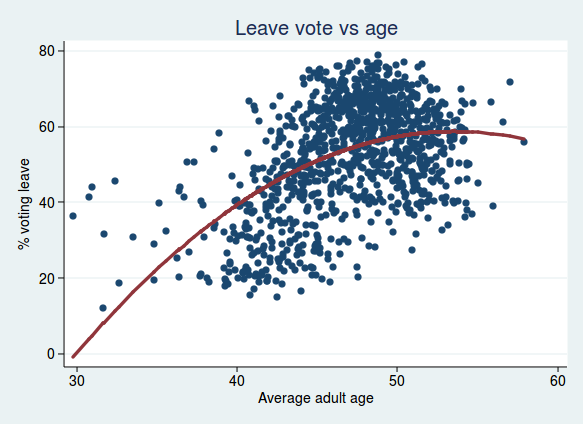
For age, I found that adding a quadratic term improved the regression model, so the relationship between age and voting leave is curved, and increases with age at first, but tails off at older age groups:
Rosenbaum also looked at the relationship with ethnicity, so I did too. Here I plot the percent voting leave against the % of people in each ward identifying as white. Again, I found the model was improved by a quadratic term, showing that the relationship is non linear. This fits with what Rosenbaum said in his article, namely that although populations with more white people were mostly more likely to vote leave, that relationship breaks down in populations with particularly high numbers of ethnic minorities:
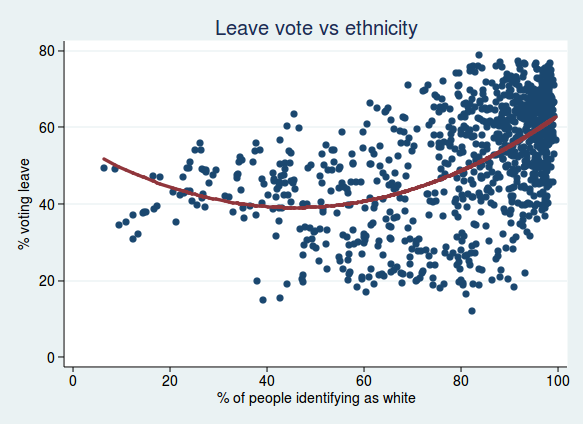
It’s interesting to note that the minimum for the % voting leave is a little over 40% white population. I suspect that the important thing here is not so much what the proportion of white people is, but how diverse a population is. Once the proportion of white people becomes very low, then maybe the population is just as lacking in diversity as populations where the proportion of white people is very high.
Anyway, the question I was interested in at the start was whether the percentage of graduates was an independent predictor of voting, even after taking account of age.
The short answer is yes, it is.
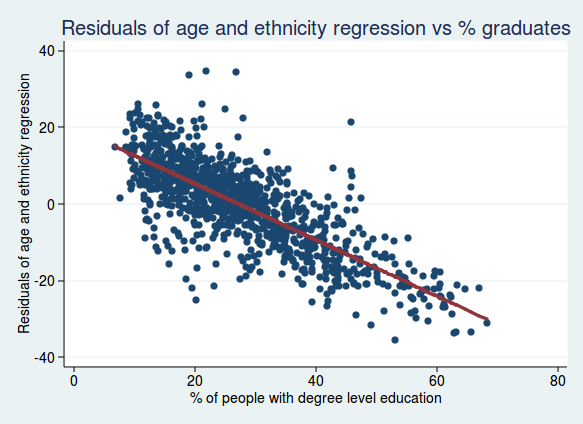
Let’s start by looking at it graphically. If we start with our regression model looking at the relationship between voting and age, we can calculate a residual for each data point, which is the difference between the data point in question and the line of best fit. We can then plot those residuals against the percentage of graduates. What we are now plotting is the voting patterns adjusted for age. So if we see a relationship with the percent of graduates, then we know that it’s still an independent predictor after adjusting for age.
This is what we get if we do that:
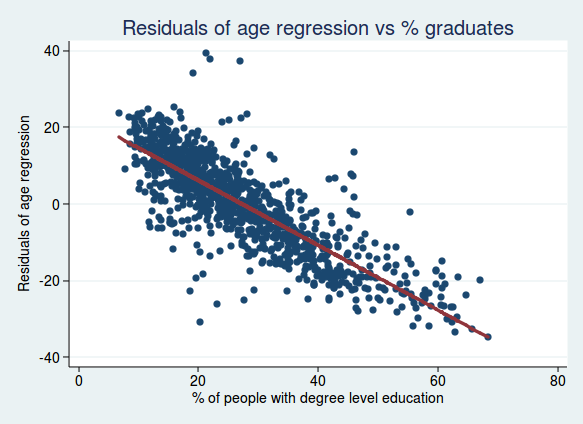
As you can see, it’s still a very strong relationship, so we can conclude that the percentage of graduates is a good predictor of voting, even after taking account of age.
What if we take account of both age and ethnicity? Here’s what we get if we do the same analysis but with the residuals from an analysis of both age and ethnicity:
Again, the relationship still seems very strong, so the percentage of graduates really does seem to be a robust independent predictor of voting.
For the more statistically minded, another way of looking at this is to look at the regression coefficient for the percentage of graduates alone, or after adjusting for age and ethnicity (in all cases with the % voting leave as the dependent variable). Here is what we get:
| Model | Regression cofficient | t | P value |
| Education alone | -0.97 | -45.9 | < 0.001 |
| Education and age | -0.90 | -52.5 | < 0.001 |
| Education and ethnicity | -0.91 | -55.0 | < 0.001 |
| Education, age, and ethnicity | -0.89 | -53.9 | < 0.001 |
So although the regression coefficient does get slightly smaller after adjusting for age and ethnicity, it doesn’t get much smaller, and remains highly statistically significant.
What if we turn this on its head and ask whether age is still an important predictor after adjusting for education?
Here is a graph of the residuals from the analysis of voting and education, plotted against age:
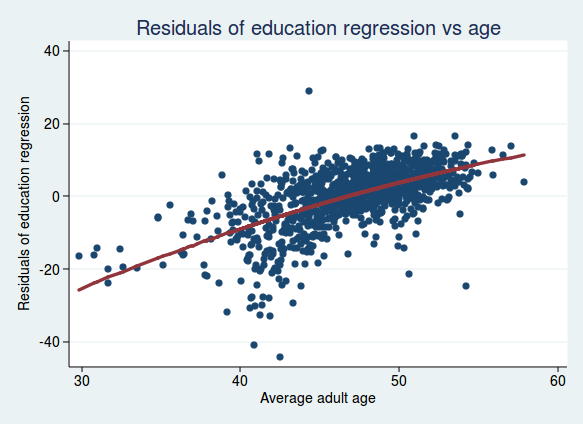
There is still a clear relationship, though perhaps not quite as strong as before. And what if we look at the residuals adjusted for both education and ethnicity, plotted against age?
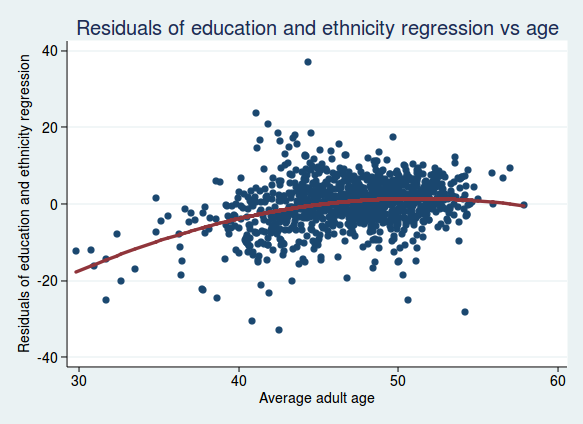
The relationship seems to be flattening out, so maybe age isn’t such a strong independent predictor once we take account of education and ethnicity (it turns out that areas with a higher proportion of white people also tend to be older).
For the statistically minded, here are what the regression coefficients look like (for ease of interpretation, I’m not using a quadratic term for age here and only looking at the linear relationship with age).
| Model | Regression cofficient | t | P value |
| Age alone | 1.66 | 17.2 | < 0.001 |
| Age and education | 1.28 | 25.3 | < 0.001 |
| Age and ethnicity | 0.71 | 5.95 | < 0.001 |
| Age, education, and ethnicity | 0.82 | 13.5 | < 0.001 |
Here the adjusted regression coefficient is considerably smaller than the unadjusted one, showing that the initially strong looking relationship with age isn’t quite as strong as it seems once we take account of education and ethnicity.
So after all this I think it is safe to conclude that education is a remarkably strong predictor of voting outcome in the EU referendum, and that that relationship is not much affected by age or ethnicity. On the other hand, the relationship between age and voting outcome, while still certainly strong and statistically significant, is not quite as strong as it first appears before education and ethnicity are taken into account.
One important caveat with all these analyses of course is that they are based on aggregate data for electoral wards rather than individual data, so they may be subject to the ecological fallacy. We know that wards with a high percentage of graduates are more likely to have voted remain, but we don’t know whether individuals with degrees are more likely to have voted remain. It seems reasonably likely that that would also be true, but we can’t conclude it with certainty from the data here.
Another caveat is that data were not available from all electoral wards, and the analysis above is based on a subset of 1070 wards in England only (there are 8750 wards in England and Wales). However, the average percent voting leave in the sample analysed here was 52%, so it seems that it is probably broadly representative of the national picture.
All of this of course raises the question of why wards with a higher proportion of graduates were less likely to vote leave, but that’s probably a question for another day, unless you want to have a go at answering it in the comments.
Update 12 February 2017:
Since I posted this yesterday, I have done some further analysis, this time looking at the effect of socioeconomic classification. This classifies people according to the socioeconomic status (SES) of the job they do, ranging from 1 (higher managerial and professional occupations) to 8 (long term unemployed).
I thought it would be interesting to see the extent to which education was a marker for socioeconomic status. Perhaps it’s not really having a degree level education that predicts voting remain, but it’s being in a higher socioeconomic group?
To get a single number I could use for socioeconomic status, I calculated the percentage of people in each ward in categories 1 and 2 (the highest status categories). (I also repeated the analysis calculating the average status for each ward, and the conclusions were essentially the same, so I’m not presenting those results here.)
The relationship between socioeconomic status and voting leave looks like this:
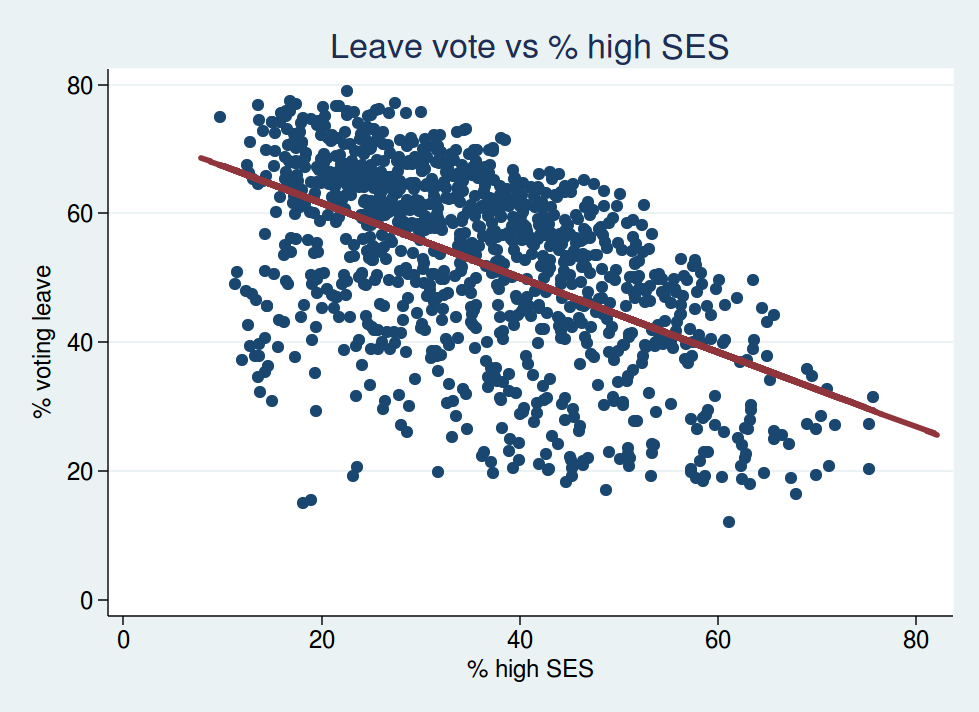
This shouldn’t come as a surprise. Wards with more people in higher SES groups were less likely to vote leave. That fits with what you would expect from the education data: wards with more people with higher SES are probably also those with more graduates.
However, if we look at the multivariable analyses, this is where it starts to get interesting.
Let’s look at the residuals from the analysis of education plotted against SES. This shows the relationship between voting leave and SES after adjusting for education.
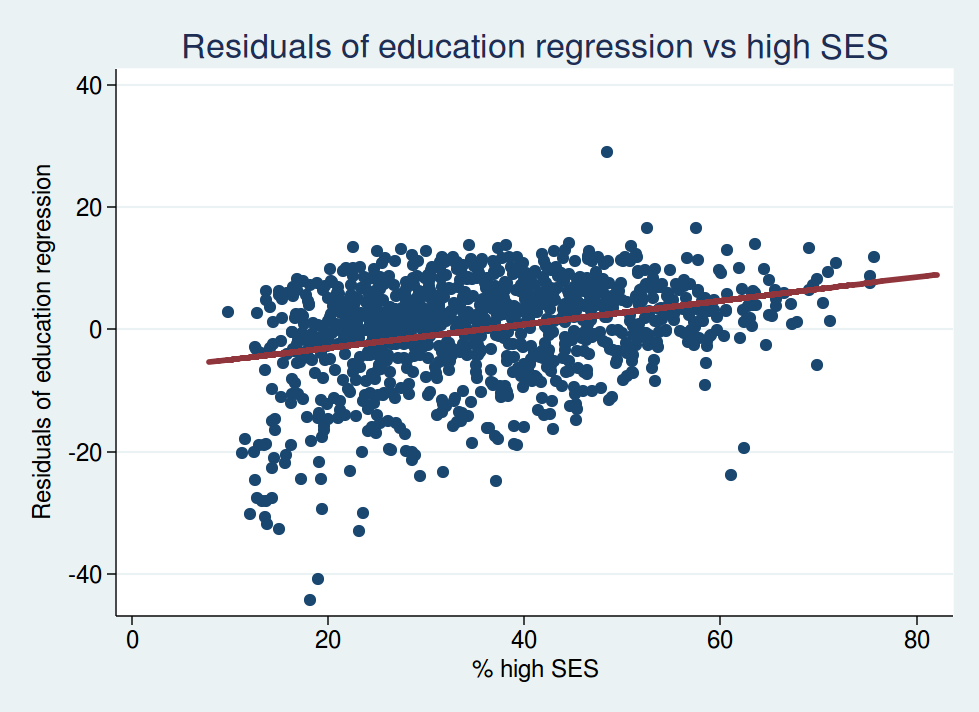
You’ll note that the slope of the best-fit regression line is now going the other way: it now slopes upwards instead of downwards. This tells us that, for wards with identical proportions of graduates, the ones with higher SES are now more likely to vote leave.
So what we are seeing here is most definitely a correlation between education and voting behaviour. Other things (ie education) being equal, wards with a higher proportion of people in high SES categories were more likely to vote leave.
For the statistically minded, here is what the regression coefficients look like. Here are the regression coefficients for the effect of socioeconomic status on voting leave:
| Model | Regression cofficient | t | P value |
| SES alone | -0.58 | -20.6 | < 0.001 |
| SES and education | 0.81 | 26.5 | < 0.001 |
| SES, education, and ethnicity | 0.49 | 12.4 | < 0.001 |
| SES, education, age, and ethnicity | 0.31 | 6.5 | < 0.001 |
Note how the sign of the regression coefficient reverses in the adjusted analyses, consistent with the slope in the graph changing from downward sloping to upward sloping.
And what happens to the regression coefficients for education once we adjust for SES?
| Model | Regression cofficient | t | P value |
| Education alone | -0.97 | -45.9 | < 0.001 |
| Education and SES | -1.75 | -51.9 | < 0.001 |
| Education, SES, age, and ethnicity | -1.20 | -23.4 | < 0.001 |
Here the relationship between education and voting remain becomes even stronger after adjusting for SES. This shows us that it really is education that is correlated with voting behaviour, and it’s not simply a marker for higher SES. In fact once you adjust for education, higher SES predicts a greater likelihood of voting leave.
To be honest, I’m not sure these results are what I expected to see. I think it’s worth reiterating the caveat above about the ecological fallacy. We do not know whether individuals of higher socioeconomic status are more likely to vote leave after adjusting for education. All we can say is that electoral wards with a higher proportion of people of high SES are more likely to vote leave after adjusting for the proportion of people in that ward with degree level education.
But with those caveats in mind, it certainly seems as if it is a more educated population first and foremost which predicts a higher remain vote, and not a population of higher socioeconomic status.
Hi,
Really interesting. This answered the same age/graduates question I had. I’m still curious to know why graduates were more likely to vote remain than non-graduates.
Cheers
Only way to find out is to ask them.
The arrogant snobs you read on the Indie and Guardian will just say that the Brexiters are simply stupid, misled etc and the fact most graduates supported staying is proves it. It might also be that university graduates are not as bright as they think they are, do not dissect evidence as they should, are led by their teachers and superiors and are prone to groupthink.
Who knows?
One interesting analysis was done by the BBC on oe of their podcasts, they interviewed peopel in a brevet area and in a remain area and attitudes were interesting. Fundamentally the brexit people were patriotic and strongly for their local community. The remain interviewees had little sense of community and no sense patriotism – saying things like they didn’t really associate with any country.
I read an article recently which suggested that the wealthy and intellectuals tense dot be less patriotic and more prone so identify with others of their own kind (who could as easily be foreign) as they did with their own countrymen. Many who voted brexit feel left behind by what they perceive as globalisation, whereas I suspect retainers embrace and enjoy it.
The above is mostly anecdotal rather than statistical.
Or you can take the quote “Members of labor unions, and unorganized unskilled workers, will sooner or later realize that their government is not even trying to prevent wages from sinking or to prevent jobs from being exported. Around the same time, they will realize that suburban white-collar workers – themselves desperately afraid of being downsized – are not going to let themselves be taxed to provide social benefits for anyone else.
At that point, something will crack. The nonsuburban electorate will decide that the system has failed and start looking for a strongman to vote for, someone willing to assure them that, once he is elected, the smug bureaucrats, tricky lawyers, overpaid bond salesmen, and postmodernist professors will no longer be calling the shots.” and draw your own conclusions about Brexit, populism and trump.
From “Achieving our Country” by Richard Rorty, currently its doing the rounds of the American scribblers and no doubt coming to a liberal newspaper near you soon.
Interesting. Are you suggesting that perhaps the Remain voters have had their sense of community solidarity educated out of them?
Patriotism and nationalism are strongly associated with lower education.
Not stupidity. But definitely ignorance (in the real sense of the term)
Higher educated individuals are less prone not none analytical thought.
I’d question “are not going to let themselves be taxed to provide social benefits for anyone else.”. A lot of what I hear from people who’d vote for Brexit is that these people would also vote for parties that promise tax cuts. It’s also the same in America.
I’m one of your “white collar workers” and also a Remainer (more so now I’ve seen how negotiations have gone), yet I’d wish that we had a government who did tax more to provide better services for all. I see how it works in Northern Europe, yet our gutter press here decry it as socialism and we’re stuck with Small State Tories.
1992 education act.
Because there are more graduates in the softer (non-mathematical / non-analytical) subjects than there are in the harder subjects.
North south divide on remain/leave shows that people engaged in numerical / practical work more able to understand the intricacies of economics than those in emotional roles.
I sometimes more cynically wonder if it isn’t because many graduates are a self selecting pool of the credulous with an inflated sense of their own abilities.
I say that as a graduate myself. If it was almost any other product I can think of it would be an enormous mis-selling scandal, evidenced by the fact that about half of graduates are working in jobs which don’t require a degree at all.
If I’m honest I went to university to make my mother happy and delay getting a proper job. Not something that gives my opinions on geopolitics any particular weight.
I’ve always believed that you went to university if your desired career path required you to do so, as in professionals- doctors, vets solicitors and the like not just to toss it off for 3 to 5 years.
Interesting to come back to this in July 2020.
I am a mathematician by trade so I can appreciate the theoretical interest of such analysis. But frankly five minutes conversation with the typical leave voter would leave you in no doubt about the negative correlation between intelligence and support for brexit.
Not that there aren’t some educated and intelligent leave supporters, such as the economist Minton, but such men have none of the populist delusions about brexit held by ordinary brexit supporters. Minton cheerfully admits that brexit will wipe out what remains of British industry and agriculture. It’s just that he thinks this is a good thing!
As we now lurch toward a no deal brexit, and as border infrastructure is being set up that will make imports more expensive and British exports less competitive in the EU, the same imbecilic arguments for brexit are still being advanced, now with a distinct sense of nihilism attached to them.
Bring it on, I say. People need to be kicked in the mouth by brexit. Like the scalded child it is the only way they will learn not to be so dumb next time some cynical populist makes promises to them.
Simple answer:
Because Brexit is/was such an unbelievably stupid idea, it makes sense that people with less qualifications (therefore less ‘likely’ to be intelligent), to vote for it.
There’s a reason why the vast majority of people working in STEM fields are against Brexit…
I suspect that many people around universities were more likely to vote remain simply because universities get lots of money from the EU.
That might account for a handful of staff, but not the millions of graduates, who likely wouldn’t care once they’d already graduated.
Because they are better able to work out the pros and cons.
Because during a degree you are taught to not believe everything you read and anything you use in your degree you need to reference. You realise as you go through your degree that a lot of crap is out there and the you need to find factual information, not just the first thing you have read… or in the case of Daily Mail readers, just the headline.
More critical thinking and less susceptibility to populism, which requires critical thinking be thrown out the window?
It may be that university life meant close links with students from other countrey’s.
Thank you. I referenced your posting here:
https://iea.org.uk/are-brexit-voters-really-less-intelligent-than-remainers/
What this analysis doesn’t cover is the fact that more young people stayed in education longer than those of the previous generations due to the government policy. In previous generations 10% of the population had degrees, now pushing 50%.
It does cover that. It looked at the effects of age and education separately, each adjusted for the other. That in fact was the whole point of doing the analysis in the first place, to adjust for the inter-generational differences in the proportion of graduates.
Indeed. Was about the reply with the same..
And, as you say, was the very point of the study. To take the observed correlation between education and a remain vote and check (by eliminating variables like age or ethnicity) to see if the correlation, ha, remained. It did.
But he would have known this has he actually read/understood the article.
While age and ethnicity and ses group are factors they appear to be significantly of a smaller magnitude to that of education level and independent from it.
It maybee and that the younger generation is better educated as a whole than their seniors but that just feeds back into the results of the study rather than undermining it.
18-24 yr olds = 36% Turnout 65+yrs old = 83% Turnout. Do all the 36% have degrees or were they doing a course? Knowing the NUS they will have whipped students to vote, some even more than once if the GE is a guide.
The NUS has remarkably little influence over students
How do you imagine the NUS “whips” students to vote?
Free beer. A lot of free beer.
Thank you for this interesting analysis.
A couple of things are often forgotten in the “education & brexit” link.
Older people are vastly less likely to have gone to University, for many decades it was about 3% of the population. However anyone classified as a “younger” voter will be in a peer group that had more than ten times that portion go on to university.
Then there is the question of subjects studied. Older graduates will have studied a relatively narrow range of “traditional” subjects. More recent, “younger”, voters will have been offered subjects that didn’t used to exist. There has also been considerable concern reported by employers that some current graduates are not as good and the subjects they have studied are of dubious value.
I have tried to find historical data relating to what subjects were being studied, and by how many students, but I can’t find anything via Google. My suspicion is that “subject studied at higher education” might by a very telling indicator.
Does the ability to speak another language correlate with voting remain? I would guess so, because any ability in another language facilitates understanding and appreciation of the people who speak that language.
That’s a good question, Hugh. I would also guess the same as you, but I’m not aware of any data that would help to remove the guesswork.
At the risk of stating the blindingly obvious, has anyone considered that maybe those who are more educated are also more likely to be objectively right on the question of EU membership?
Isn’t education meant to make people better able to process and evaluate information, and thus better able to make rational decisions that benefit rather than harm society?
One could argue, I suppose, that education makes people more likely to misinterpret data and more likely to make bad decisions, but in that case we had better close all schools right now before any more harm is caused to our young people.
Unfortunately it’s not obvious to idiots… This is why democracy fails, you’re letting EVERYONE vote, and unfortunately most people really aren’t capable of looking at the big picture.
I would rather argue that the information that “EVERYONE” consumes on such topics is manipulated in such a way as to alter what “big picture” they are seeing.
One thing not mentioned here is the geographical distribution.
There are recurring articles about underachievement of ‘white working class boys’ (in fact ‘White British’ boys on free school meals, so a very limited definition of both ‘white’ and ‘working class’).
Separately, schools in coastal towns and some rural locations find it very difficult to recruit teachers – this never seems to be properly linked to exam results though. One reason given for that is that if you’re a couple, and only one of you is a teacher, somewhere like the Isle of Wight probably doesn’t have good job prospects for your partner. Given that coastal and rural areas are predominantly white, people have linked coastal results on whiteness, but it could equally be the coastal-ness (uneven development, transport links etc) that causes the results, and simply correlates with whiteness.
So could the correlation with education level and Brexit voting actually be with urbanism or at least partly explained by it? An article I read (which I can’t find, I landed here instead) talked about general education levels impacting voting intention regardless of individual education level (i.e. if I am one of 20% of people educated to 16, in an area where 80% are postgraduate, then I am more likely to vote remain. But if I am one of 20% postgraduate, in an area 80% educated to 16, more likely to vote leave).
That’s a great question, Nat, and in fact it’s such a good question that I downloaded the data on urban or rural status of electoral wards and added them to the analysis to see what difference it made.
If you look at rural-urban classification alone as a predictor of Brexit voting, then it is much as you’d expect, with rural areas significantly more likely to vote leave than urban ones.
But if you add that into the multivariate analysis, it makes very little difference to the effects of education. If you look at the regression equation including just education and age, the regression coefficient for education is -0.907. Add in the rural-urban classification, and the coefficient changes to -0.903. So pretty much identical really.
On the other hand, the effect of urban-rural setting is much reduced when you include education in the model with it. So in fact it’s probably true to say that the effect of rural-urban setting is explained to a large extent by the different percentage of graduates in those different areas.
Agree with all your comments: it’s simple maths. If those at the bottom of the social scale have £x and you offer them a raise of £y, by means of internationalisation, customs union etc, that’s good – bigger flatscreen TVs, holidays to Magaluf etc. BUT if you offer them a raise of £y, only I t comes accompanied with a large new ‘foreign’ cohort, who are joining you at the same social economic level, or even surpassing you, it’s another matter.
Capitalism is about competition, our relative position in the social order, not absolute gains. We have ENOUGH wealth already, all of us; there was a time when a colour TV would have been the height of luxury, and we’d have been utterly satisfied. We can manage without the new gizmos, which won’t be on sale until next year; what we want is to maintain our position in the social order, we don’t wanna fall back, lose out in the competition. So watching Polish people arrive, and double their income to match ours, is intolerable, regardless of a 5% personal wealth gain. This is what Trump realised too didn’t he? Blue collar Americans are MORE concerned by the Chinese rushing up on the inside, than they are by their own wealth changes: in other words, if they had a choice between adding 5% to their annual income, whilst the Chinese double theirs, or losing 5% of theirs whilst the Chinese GDP flatlined, they’d take the latter. Isn’t this why Trump’s protectionism will work?
The ones at the bottom of the Social Economic Scale always have the most to lose in relative changes to the social economic scale. Look at the Afrikaans, who ruthlessly defended their position at the bottom of the South African social economic scale from the possibility of black incursion.
‘Patriotism’ does indeed apparently offer a free source of pride for the uneducated. It’s how the right wing elite have exploited the blue collar manpower to fight their wars, accept their injustices etc. I suppose if you destroy the hope of (French-style) revolution, by violent repression (Peterloo etc), you leave the lower classes, the uneducated little choice.
The elite stand to benefit most of all of course. Asked why he so fiercely backed Brexit Rupert Murdoch explained: When I go into Downing Street the Prime Minister has to do what I say; when I go into Brussels nobody listens. Michael Caine (forelock-tugging courtier type): I’d rather be a poor master than a rich slave. The same mathematical principle might be applied as for the blue collar: EC membership might bring in say a 5% increase in wealth per annum; but, power for those in Westminster is (seen as) divided by 27 – all the other representatives in the EU Parliament. One might put a value on that (sense of power): if Westminster power=£270, Westminster power as part of a European Union must be divided by 27, to equal £10.
Soooo, there we have it, the elite GAIN far more in power by leaving the EU, than they lose in money. Fifty-four times as much.
I love your analysis, thank you!
I’m a Cambridge University educated businessman who voted Leave but I am a minority in Cambridge where almost everyone I know voted Remain. However, most of the Remain voters I know are academics entirely reliant upon EU funding.
My suspicion is that the correlation between voting and education is skewed simply by EU-funded academics voting to Remain in order to keep their funding. In fact, the number of UK graduate students and university staff roughly equals the gap between Leave and Remain votes.
Is it possible to take EU funding into account?
I was watching a BBC TV show where they give an educational experience to a group of kids for a day or two based on educational practice in the 1890s, 1950s, 60s, 70s and 80s. In the 60s one, they said that whilst 1 in 8 grammar school kids went to University, one in 25,000 secondary modern kids went.
Now, most analysis of brexit have noted the very strong link between HE education and voting in the referendum, and also how that interrelates with age. But I’ve never seen any study which tries to unpick the secondary-modern/grammar split amongst the age cohorts old enough to have exeprienced the 11+ system when it was the dominant trend (ie, up to the mid 70s, so people 55+).
I’ve long though that secondary mods are a critical factor in some perverse way, leading to generations of people who were never taught anything like critical reasoning because that wasn’t what the economic system demanded from them.
So I wouldn’t normally comment, but after reading the whole article. My summary of the findings are as follows;
The author seems keen to prove that those who voted Remain are mostly graduates and that the opinion of older people with more life experience who happen not to have degrees are not really valid.
Then comes the showstopper in the Updated analysis…
When you adjust for those that have a degree and are in a higher SES they are likely to have voted to leave.
So my conclusion is;
1. That those that studied and then applied those studies to a successful career voted leave.
2. Whilst those that studied and did not apply their leanings to later life voted remain.
I know that I would rather trust the opinion of those in the first category !
p.s. I didn’t go to University, I am over 50 and have moved myself from a working class background into a highly paid role in Technology (high SES) through hard work and consider myself to be in continuous learning.
The distribution by age looks wrong in comparison with the other data on age distribution. Age distribution and Leave/Remain vote has been quantified reliably elsewhere. I wonder what this data would look like if you substituted in the real age distribution graph and worked out the residuals from that.
I’ve come very late to this (though, apparently it is still topical).
Is it worth looking at higher order interactions to try and understand it?
As an observation, although there is correlation, there remains a lot of unexplained variation. (I’m grateful that age doesn’t explain everything.)
I was worried by the historic 3% going to university vs 50% now – I would assume people are not uniformly cleverer – there should be a consistent measure of intelligence over time. used as a factor.
I’m not convinced that the social economic scale (SES) is the same.
Age might be highly correlated with a cynical, “seen it all before” attitude; OR with wisdom. Perhaps Churchill said it well when he said: “If You Are Not a Liberal at 25, You Have No Heart. If You Are Not a Conservative at 35 You Have No Brain” (except it appears that it was not him at all: https://quoteinvestigator.com/2014/02/24/heart-head/ ).
Can I also point out around the “two million new voters and however many old voters have died” argument that all the voters are 2 years older and many will be wiser (in the Churchillian sense) and will now be Brexit supporters.
Am I missing something?
I presume you ideally wish to infer individual level behavior or relationships among features measured on individuals , which you can not from aggregate or group level data without making very strong assumptions. This is the classical “ecological fallacy”.
Perhaps someone else mentioned this or I just read through this too quickly and missed something.
Yes, you missed the paragraph where I discussed the ecological fallacy. It’s the third from last paragraph of the original post before the update.
Only just discovered this post, hence the delay in response. Very interesting.
I carried out a correlaton analysis between race (white/asian/black/mixed race) and Brexit vote between around 30 London boroughs. The results were fascinating. If you haven’t looked at this, would you like to guess the outcome?
KR,
Peter
I think that graduates are less likely to be taken in by slogans and tabloid newspapers. They are also more likely to research pros and cons and more likely to read scientific and economic advice. Most graduates are less xenophobic and understand the benefits that migrant workers provide in this country. Graduates are more likely to have aspirations of working in Europe and enjoy free movement.